Executive Summary
December 2021 IT spend totaled $1.30M with 87.5% SLA compliance, up from 79.2% in prior months, while all 3 critical SLA warnings remained above breach thresholds.
Financial Highlights
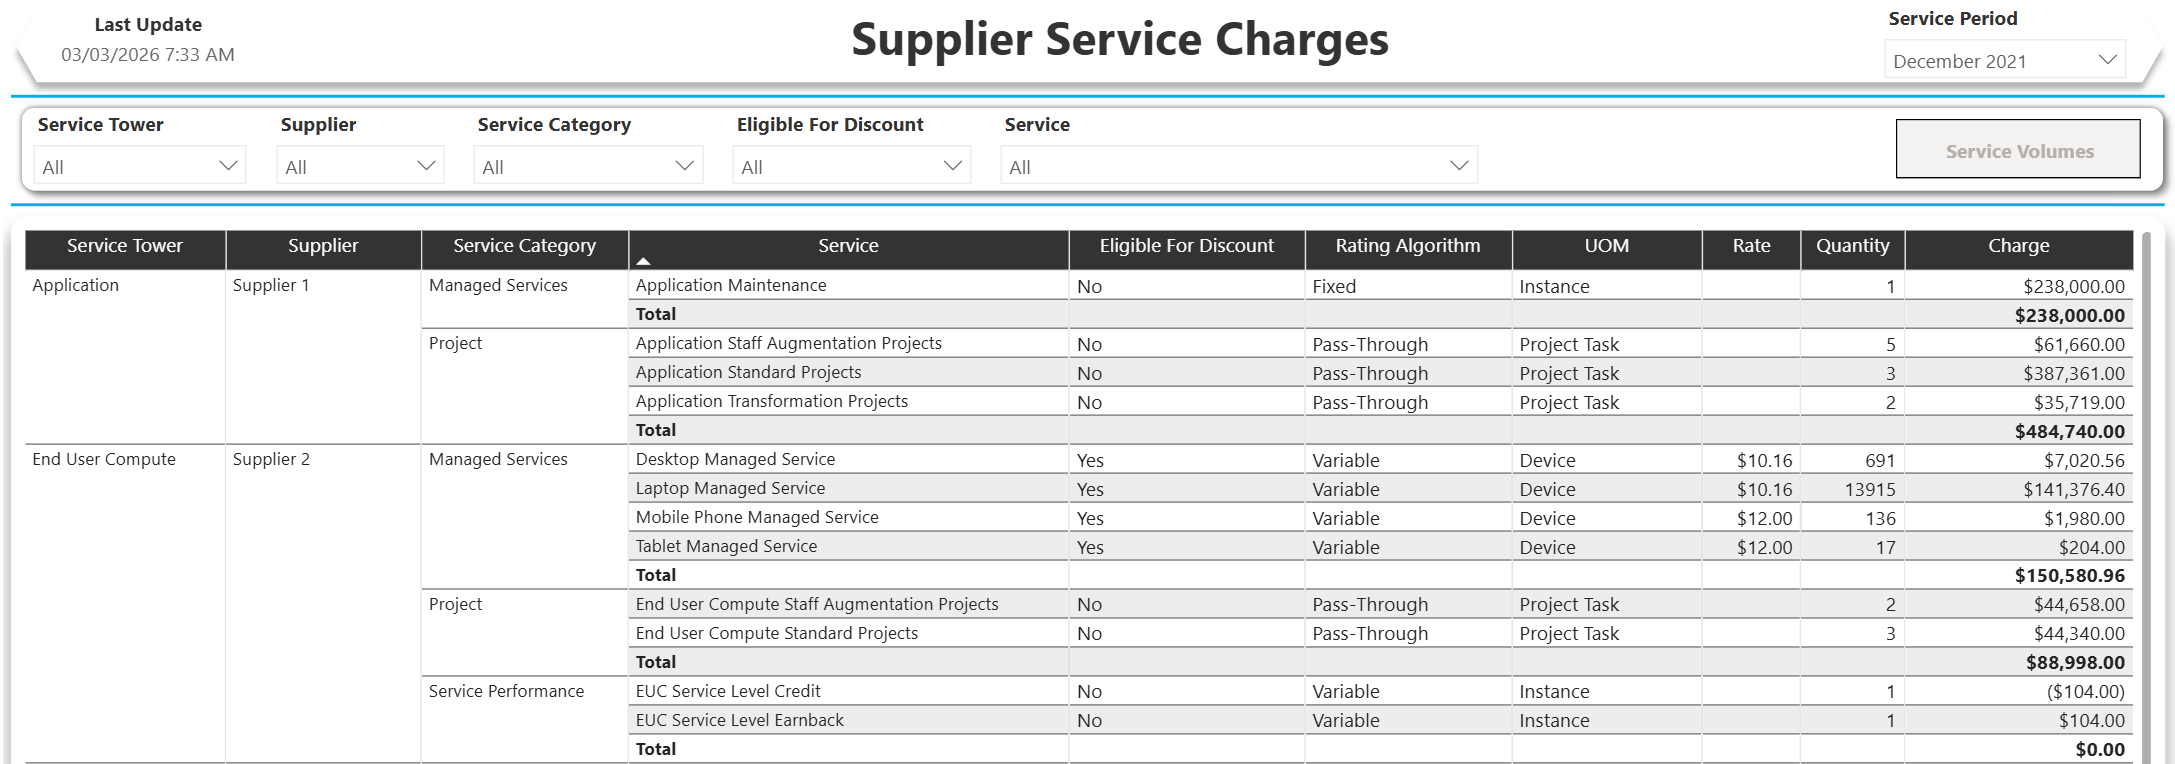
Total IT spend of $1.30M was dominated by End User Compute at $960K (74%) driven by hardware procurement, primarily rugged laptops ($420K) and monitors ($161K) from Supplier 2. Application services consumed $282K (22%) through Supplier 1, focused on maintenance activities. Server services represented the smallest portion at $59K (4%).
Service performance credits netted to zero with Supplier 2 receiving a $100 EUC credit that was fully earned back, indicating SLA performance recovered within the month.
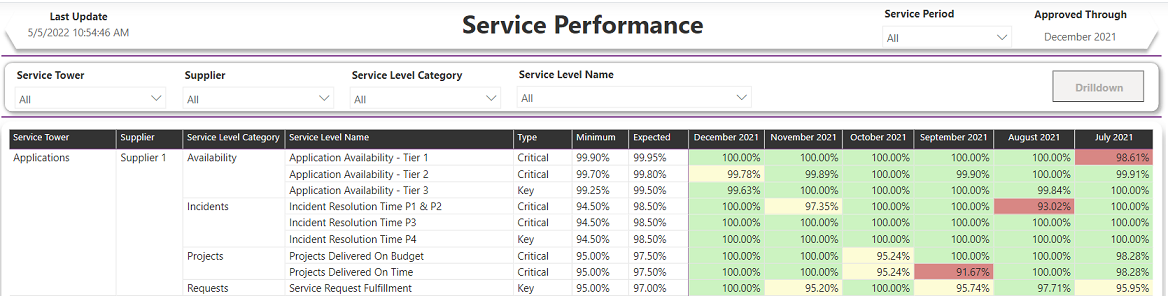
SLA compliance improved to 87.5% (21 of 24 SLAs met) versus 79.2% in the three prior months, marking the best performance since August. All critical SLA types remained in warning status with no breaches, though critical SLA compliance lagged at 81.2% compared to 100% for key SLAs.
Supplier 1 Applications: Application Availability - Tier 2 at 99.78% (target 99.8%, minimum 99.7%)
Supplier 2 EUC: Incident Resolution Time P1 & P2 at 96.08% (target 98.5%, minimum 94.5%)
Supplier 3 Server: Server Availability - Tier 2 at 99.76% (target 99.8%, minimum 99.7%)
Actions & Watch Items
Monitor Supplier 2's incident resolution performance closely as it shows the largest gap to target (2.42%) despite recent recovery trends
Validate that the $420K laptop hardware procurement aligns with planned refresh cycles and capacity requirements
Review critical SLA performance with all suppliers to sustain the December improvement and achieve consistent 90%+ compliance
IT Financial Management
December 2021 IT spend totaled $1.30M across three suppliers, with End User Compute representing 74% of total spend driven by hardware procurement.
Supplier Spend Distribution
Supplier 2 dominates at $960K (74%) with heavy End User Compute investment focused on laptop and monitor procurement. Application services from Supplier 1 represent $282K (22%), while Server services from Supplier 3 account for $59K (4%).
Supplier 2: $960K - primarily hardware procurement (Rugged-Standard laptops $420K, 24" monitors $161K)
Supplier 1: $282K - application maintenance and project resources
Supplier 3: $59K - server-related analyst and director services
Service Category Breakdown
Hardware procurement represents 59% of total spend at $772K, indicating significant equipment refresh activity. Managed services account for $402K (31%), while project spend totals $127K (10%).
Net zero service level impact as Supplier 2 earned a $100 EUC service level credit that was fully offset by a corresponding earnback, indicating SLA performance at threshold levels.
IT Service Level Management
Zero Critical SLA breaches in December with 87.5% overall compliance, up from 79.2% in prior months, but 3 Critical SLAs remain in warning status across all major suppliers.
Critical SLA Performance Shows Improvement but Gaps Remain
Critical SLA compliance improved to 81.2% (13 of 16 met) while all 8 Key SLAs achieved 100% compliance. The three Critical SLAs in warning status are positioned just above breach thresholds but missing expected performance targets by 0.02% to 2.42%.
All Major Suppliers Have Warning-Level Critical SLAs
Supplier 1 (Applications): Application Availability - Tier 2 at 99.78% vs 99.8% expected (99.7% minimum)
Supplier 2 (End User Compute): Incident Resolution Time P1 & P2 at 96.08% vs 98.5% expected (94.5% minimum) — largest gap
Supplier 3 (Server): Server Availability - Tier 2 at 99.76% vs 99.8% expected (99.7% minimum)
Watch Items:
WARNING: Supplier 2's incident resolution performance dropped significantly from 100% in November to 96.08% — closest to breach threshold
WARNING: Availability SLAs for both Supplier 1 and Supplier 3 show similar marginal underperformance patterns
- ACTION: Engage all three suppliers on performance improvement plans to move Critical SLAs from warning to met status
Customer Chargeback Analysis
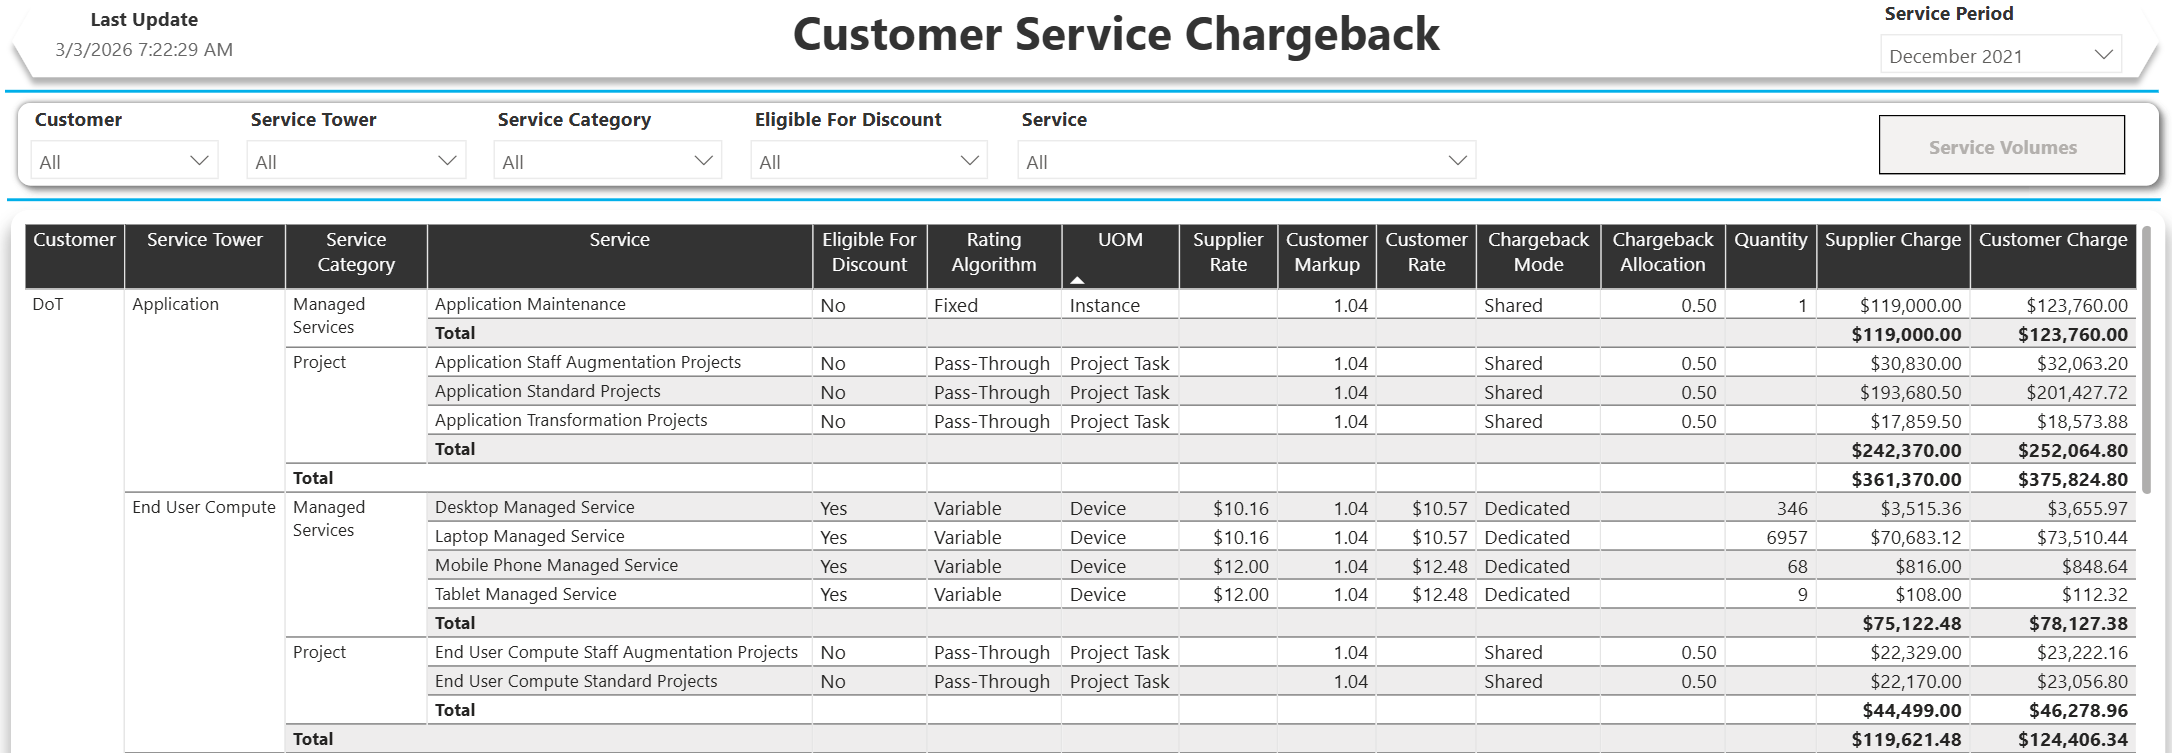
December 2021 customer chargebacks totaled $1.18M with healthy 4.0% markup generating $45.5K revenue — DoT bears 50% of costs at $591.5K, followed by HHS at $355.1K (30%) and OAG at $236.4K (20%).
Customer Cost Distribution Mirrors Expected Allocation
DoT leads customer charges at $591.5K (50%), consuming the largest share across all service towers. HHS follows at $355.1K (30%) and OAG at $236.4K (20%), with allocations aligning to expected proportional splits.
DoT: $375.8K Application, $124.4K End User Compute, $91.3K Server
HHS: $225.5K Application, $74.6K End User Compute, $54.9K Server
OAG: $150.3K Application, $49.8K End User Compute, $36.3K Server
Application Services Drive 64% of Customer Charges
Supplier 1 generates $751.6K in customer charges (64%), primarily from Application tower services across all customers. Supplier 2 contributes $248.8K (21%) through End User Compute services, while Supplier 3 adds $182.5K (15%) via Server services.
Shared Services Dominate Cost Structure
Shared chargeback model accounts for 85% of total charges at $1.01M, with dedicated charges contributing $175.3K (15%). This indicates most IT services are delivered through shared infrastructure rather than customer-specific dedicated resources.
Generated 2026-03-18 09:54:45 by AI Insights Engine
 ITBM Platform